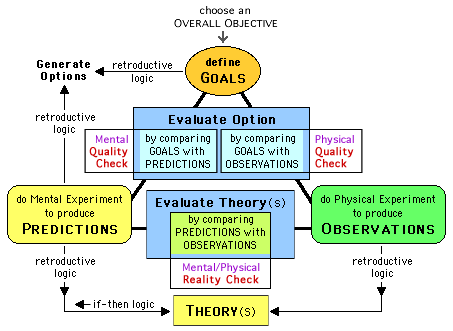
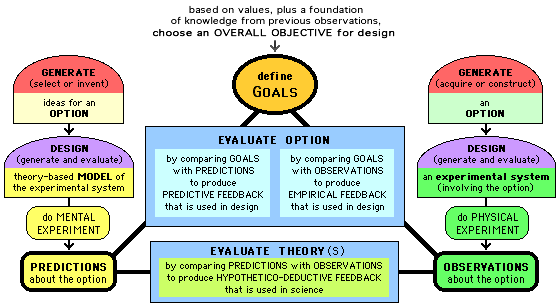
This page has verbal-and-visual representations of Integrated Design Method with 3 levels of detail
— SIMPLIFIED and BASIC and DETAILED —
that will help you understand the modes of action (1A,... 4C) and their interactive relationships
in my model of Integrated Design Method, as described in An Overview of Design Method.
( There is also an appendix with an earlier version of the basic diagram, and two more cycle-diagrams. )
an option: If you want a “discovery learning” adventure, look at the first diagram below and think about it
(use a piece of paper to cover up the diagrams below initially, and eventually the “hiding” can be controlled by
using the scroll-bar) and let your thinking be stimulated by the different kinds of visual-and-verbal representations.
Here are five diagrams:
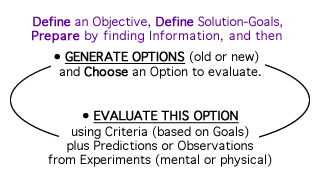
To show that the “cycle” is actually a linear-in-time sequence of events,
![]()
and to show the pre-cycle activities, plus more detail about GENERATE and EVALUATE,
 |
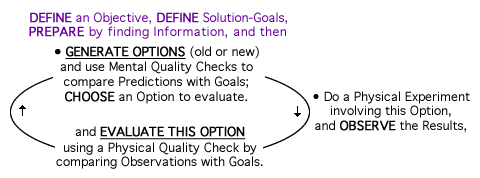
and with more detail-and-accuracy about the entire cycle, especially for EVALUATE,
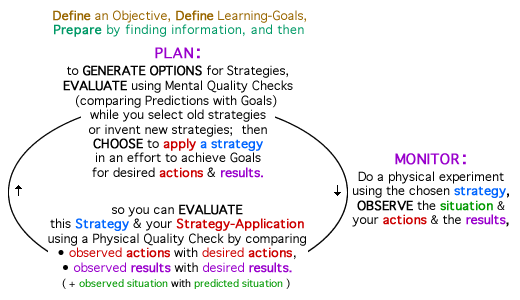
and here is a way to show the process-of-design for a Learning Strategy that uses
Quality Checks (for a strategy) and Quality Controls (for a strategy-application):
The most useful diagrams are above, but others are below:
this is the basic cycle again, but at the right it's explained in terms of its modes,

and to explain the thinking-and-actions more clearly,

![]()
and two other diagrams, which could be used for teaching the Cycle of Design, are in an appendix.
The basic diagram (above) can be simplified to focus attention on the difference between Design and Science,
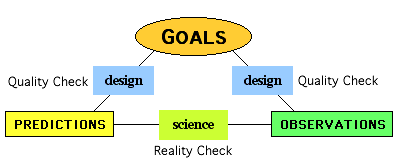
and because Science is one type of Design, it's useful to make a distinction between
Conventional Design and Science, which is shown below and is explained in An Introduction to Design.

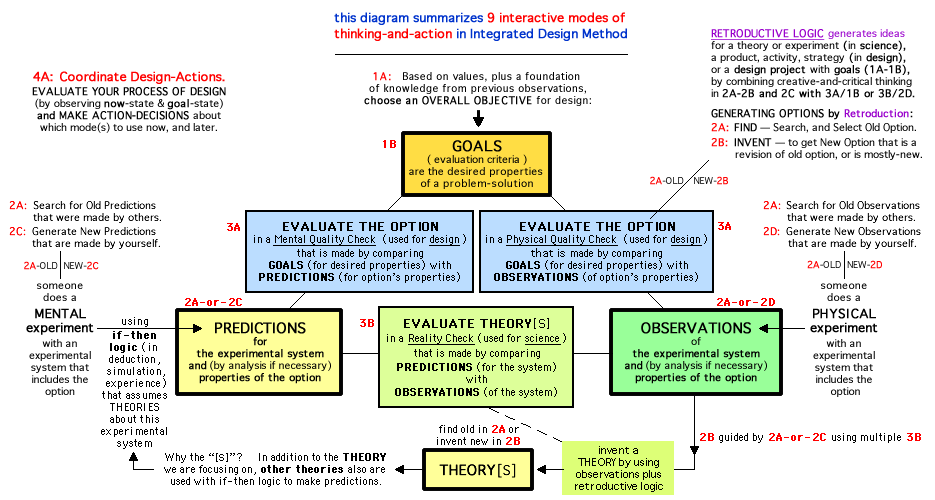
The table below is another way to look at the interactive mode-relationships in the diagram above.
GOALS are used as Evaluation Criteria
( define Goals for the Desired Properties of a satisfactory Problem-Solution ) |
|||
USE - Compare PREDICTIONS vs GOALS (Actual Properties vs Desired Properties) this is a Quality Check in 3A - for Design |
USE - Compare OBSERVATIONS vs GOALS (Actual Properties vs Desired Properties) this is a Quality Check in 3A - for Design |
||
Generate & Use OPTIONS that are possible Problem-Solutions |
Generate & Use PREDICTIONS for Actual Properties of OPTION |
Generate & Use OBSERVATIONS for Actual Properties of OPTION |
|
Find (Remember or Locate) to GENERATE Old Options in 2A |
OLD |
Find (Remember or Locate) to GENERATE Old Predictions in 2A |
Find (Remember or Locate) to GENERATE Old Observations in 2A |
Revise/Invent retroductively to GENERATE New Options in 2B |
NEW |
you do a Mental Experiment to GENERATE New Predictions in 2C |
you do a Physical Experiment to GENERATE New Observations in 2D |
PREDICTIONS for Experimental System (for Option-Properties & more) |
OBSERVATIONS of Experimental System (of Option-Properties & more) |
||
USE - Compare PREDICTIONS & OBSERVATIONS ( is Reality Check in 3B - for Science ),
retroductively search for a match - by selecting an Old Theory, or inventing a New Theory |
|||
Below is an earlier version of the basic diagram. It has the same triangle optional — Here are two other diagrams that could be used to 
or  |
for all diagrams, copyright © 1995-2011 by Craig Rusbult, PhD
